December 16, 2024 (press release) –
The U.S. trade deficit in goods was at $112 billion in the month of October, according to the Census Bureau’s Foreign Trade data1. Compared to last year, the level has increased 13.3%, rising from $99 billion.
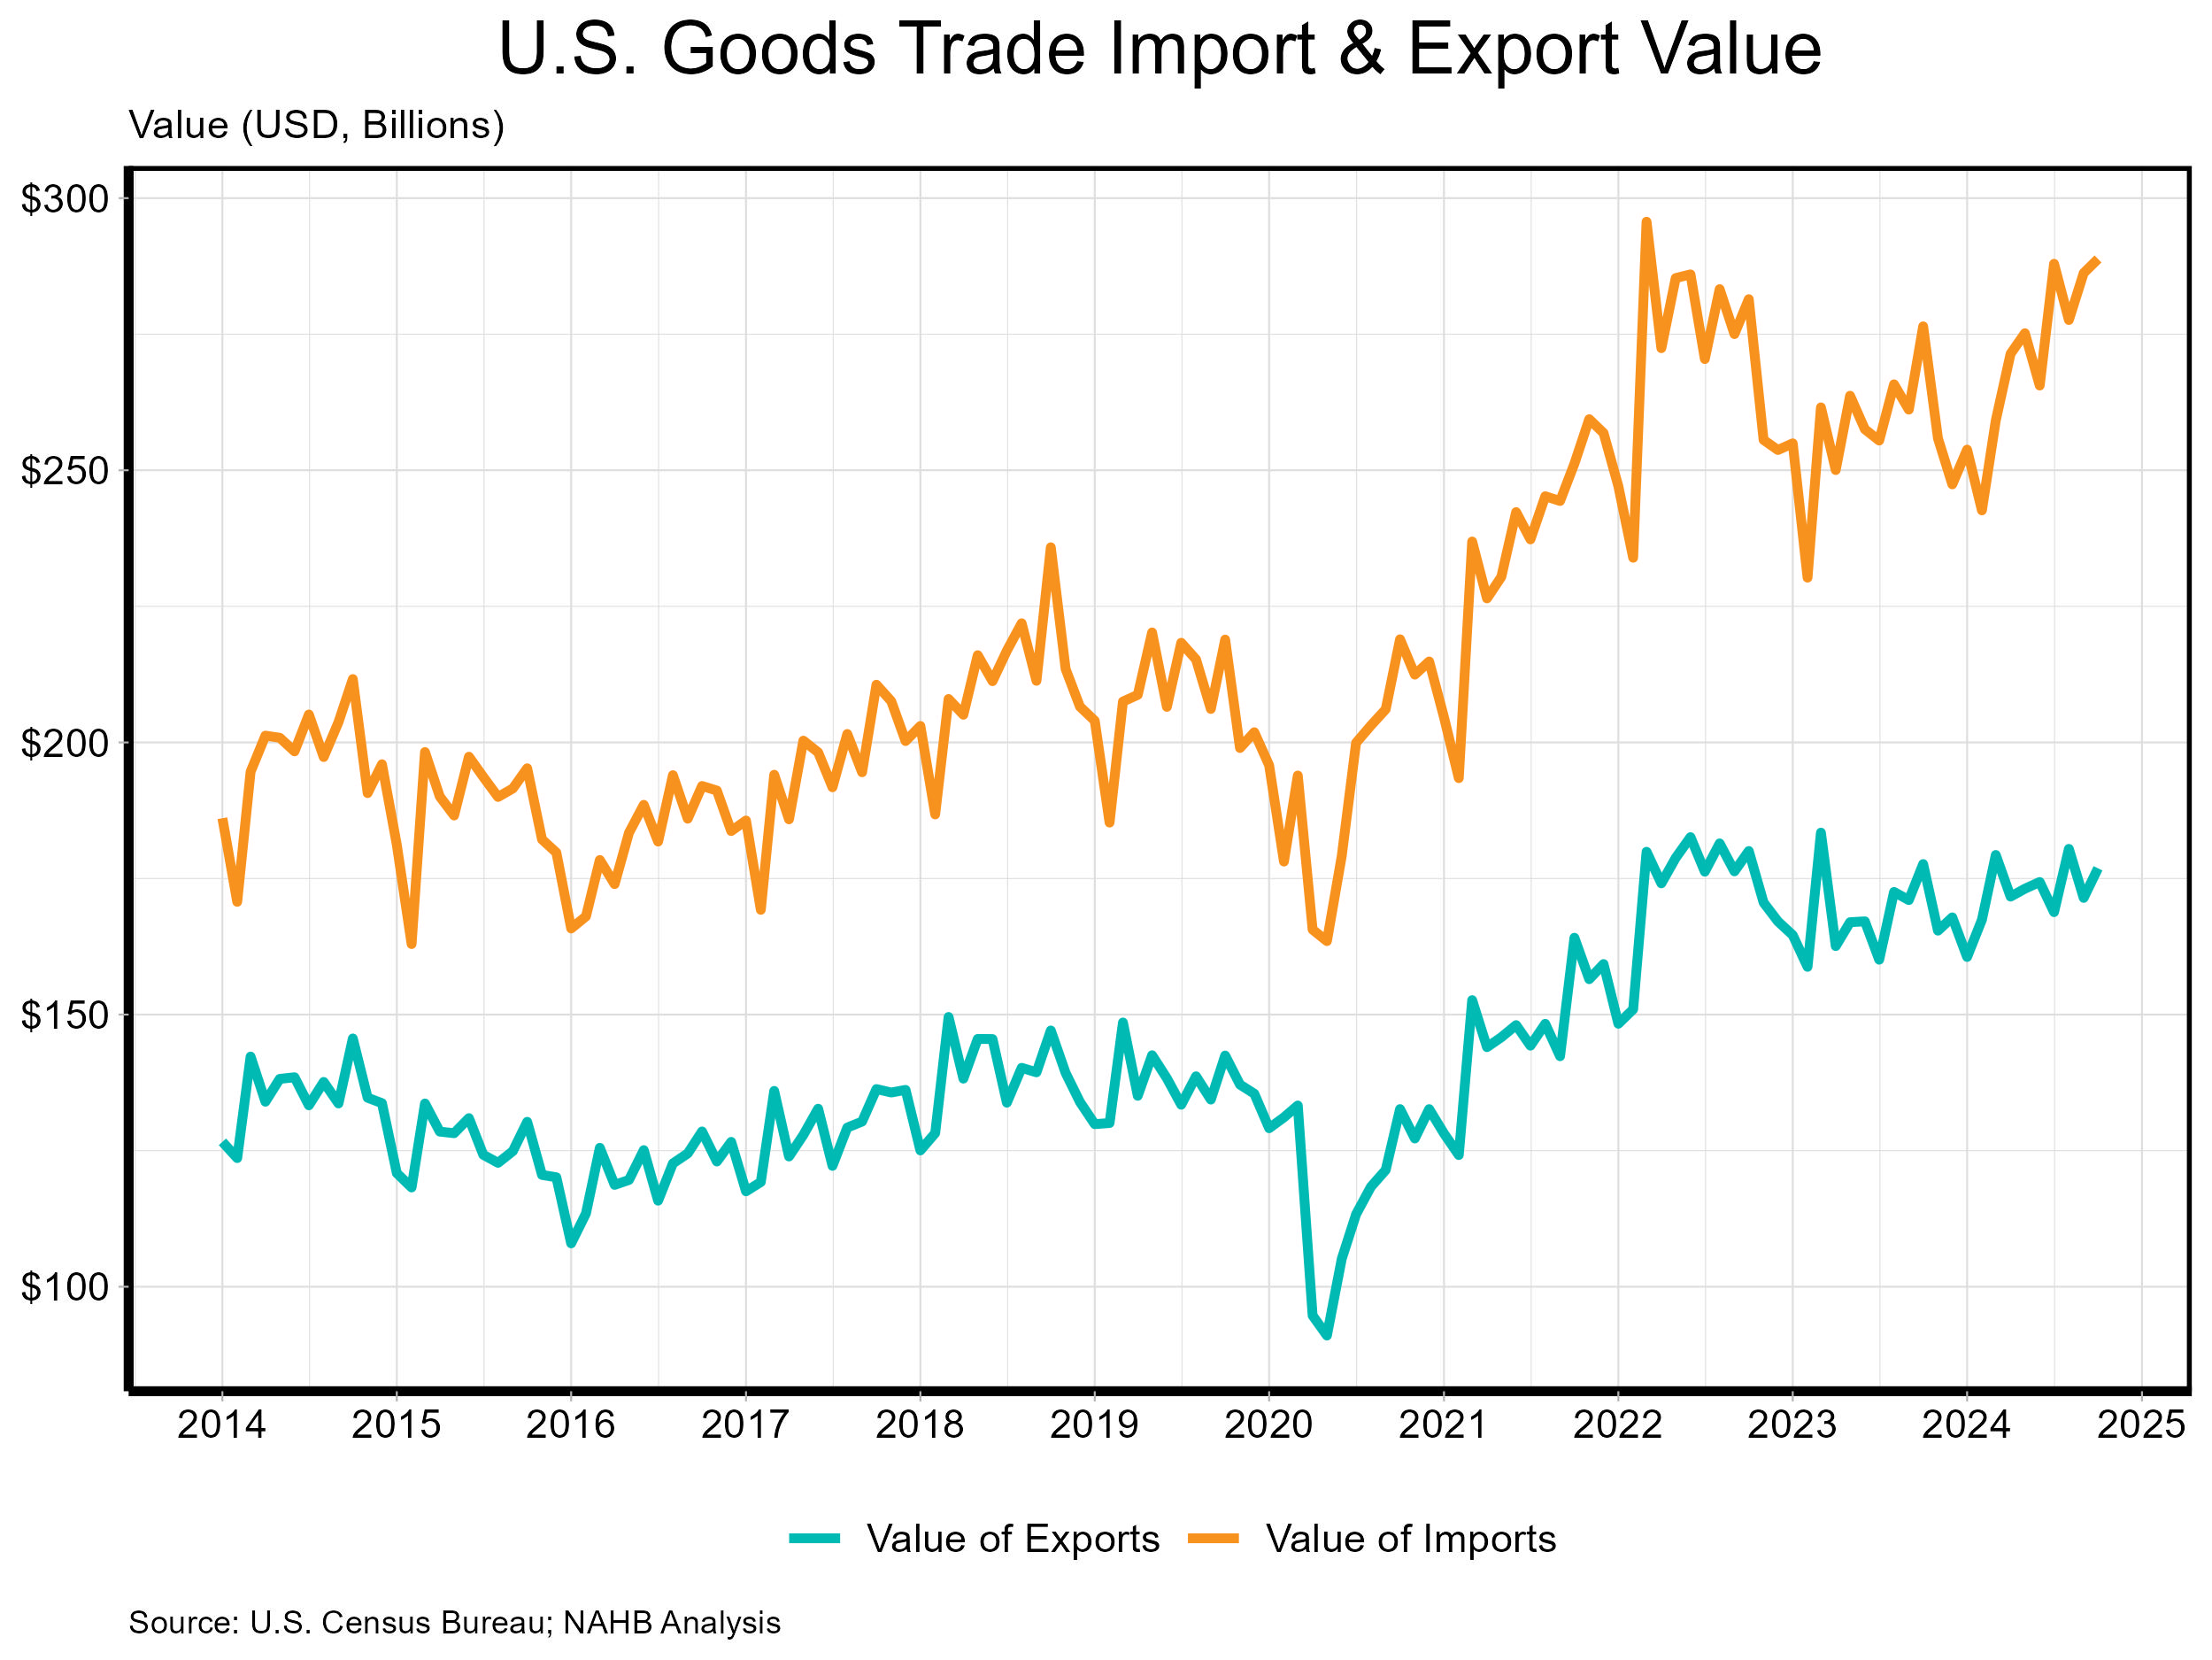
Total goods imported was valued at $289 billion while the exports were valued at $177 billion in October. The import value represents the price paid for goods at the foreign port, excluding U.S. import duties, freight, insurance, and other charges. This value includes all merchandise, whether it is sold directly into the U.S. market or re-exported to another country. The export value represents the selling price of the goods plus inland/domestic freight, insurance and other charges at the U.S. port, excluding post-export charges.
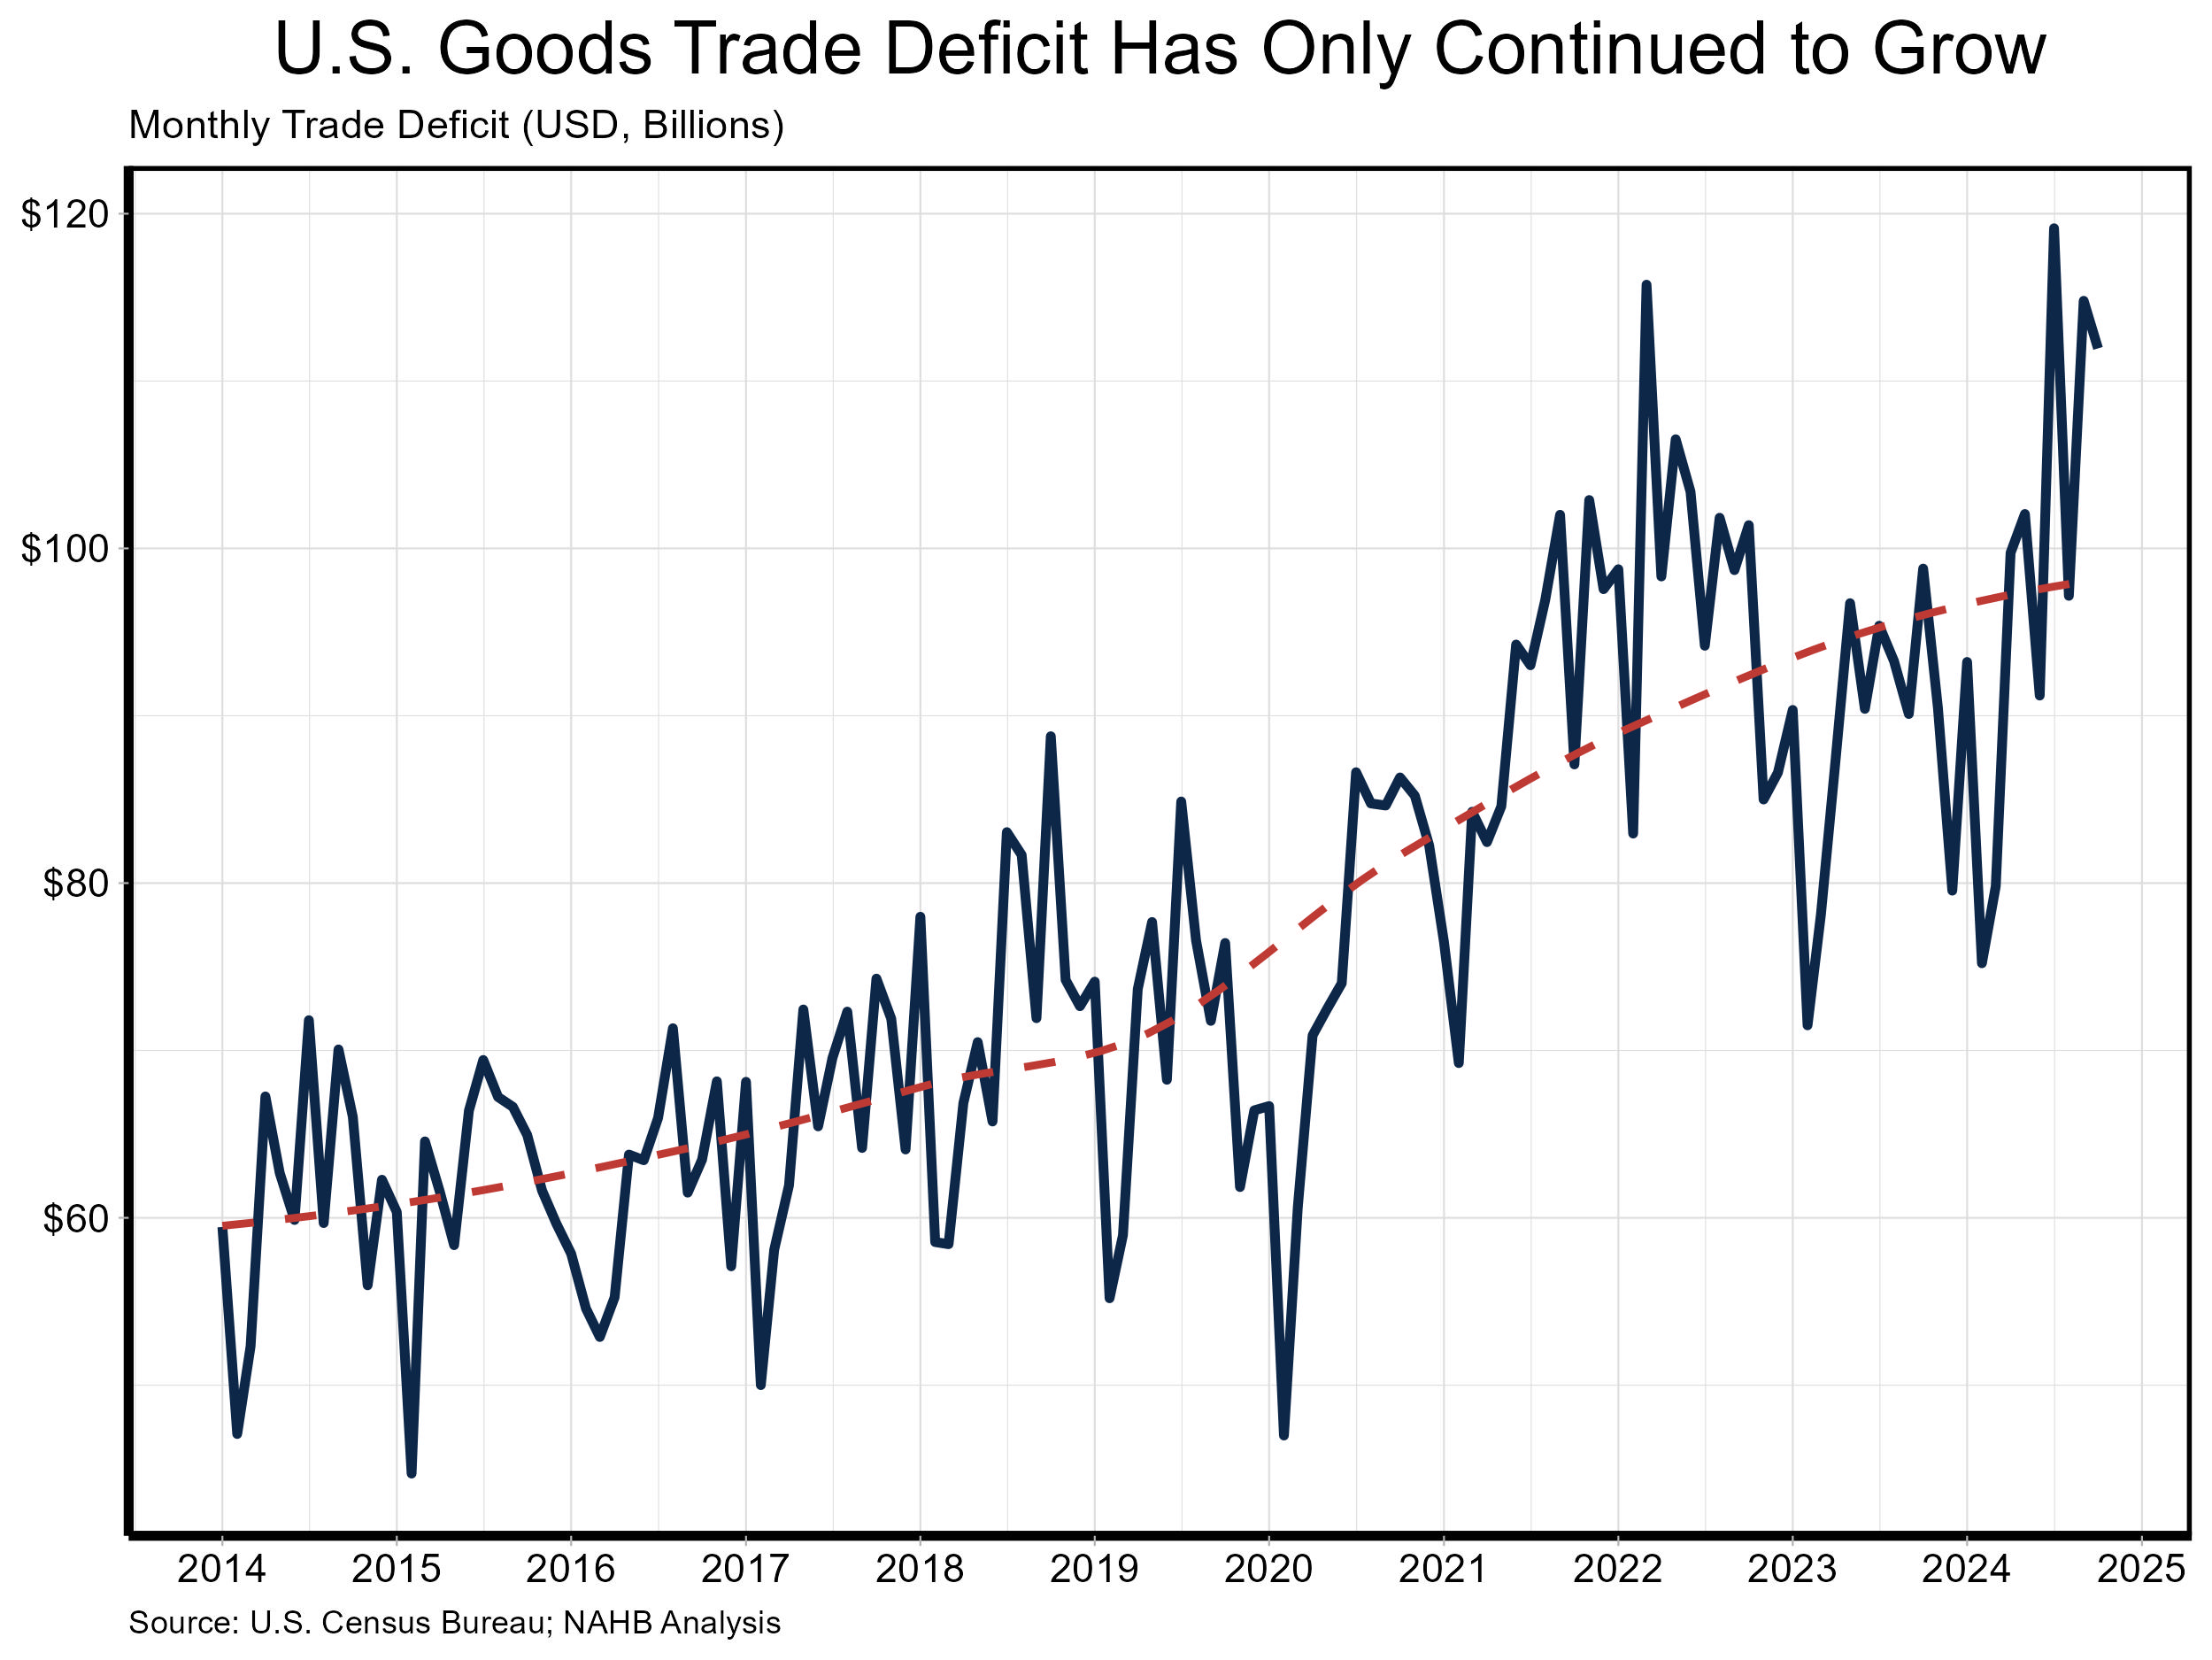
As shown above, the U.S. trade deficit in goods has continued to climb higher since 2014 when it was $59 billion. Focusing on October 2024 data, the Census reports that of the 229 countries the U.S. traded goods in October, the U.S. had a trade deficit with 102 (meaning the U.S. imported more than exported to specific country). The countries that the U.S. had the largest trade deficit with in October were China ($28.0 billion), Mexico ($16.4 billion) and Vietnam ($11.6 billion). Shown below are five countries that have the highest average trade deficit with the U.S. since 2014.
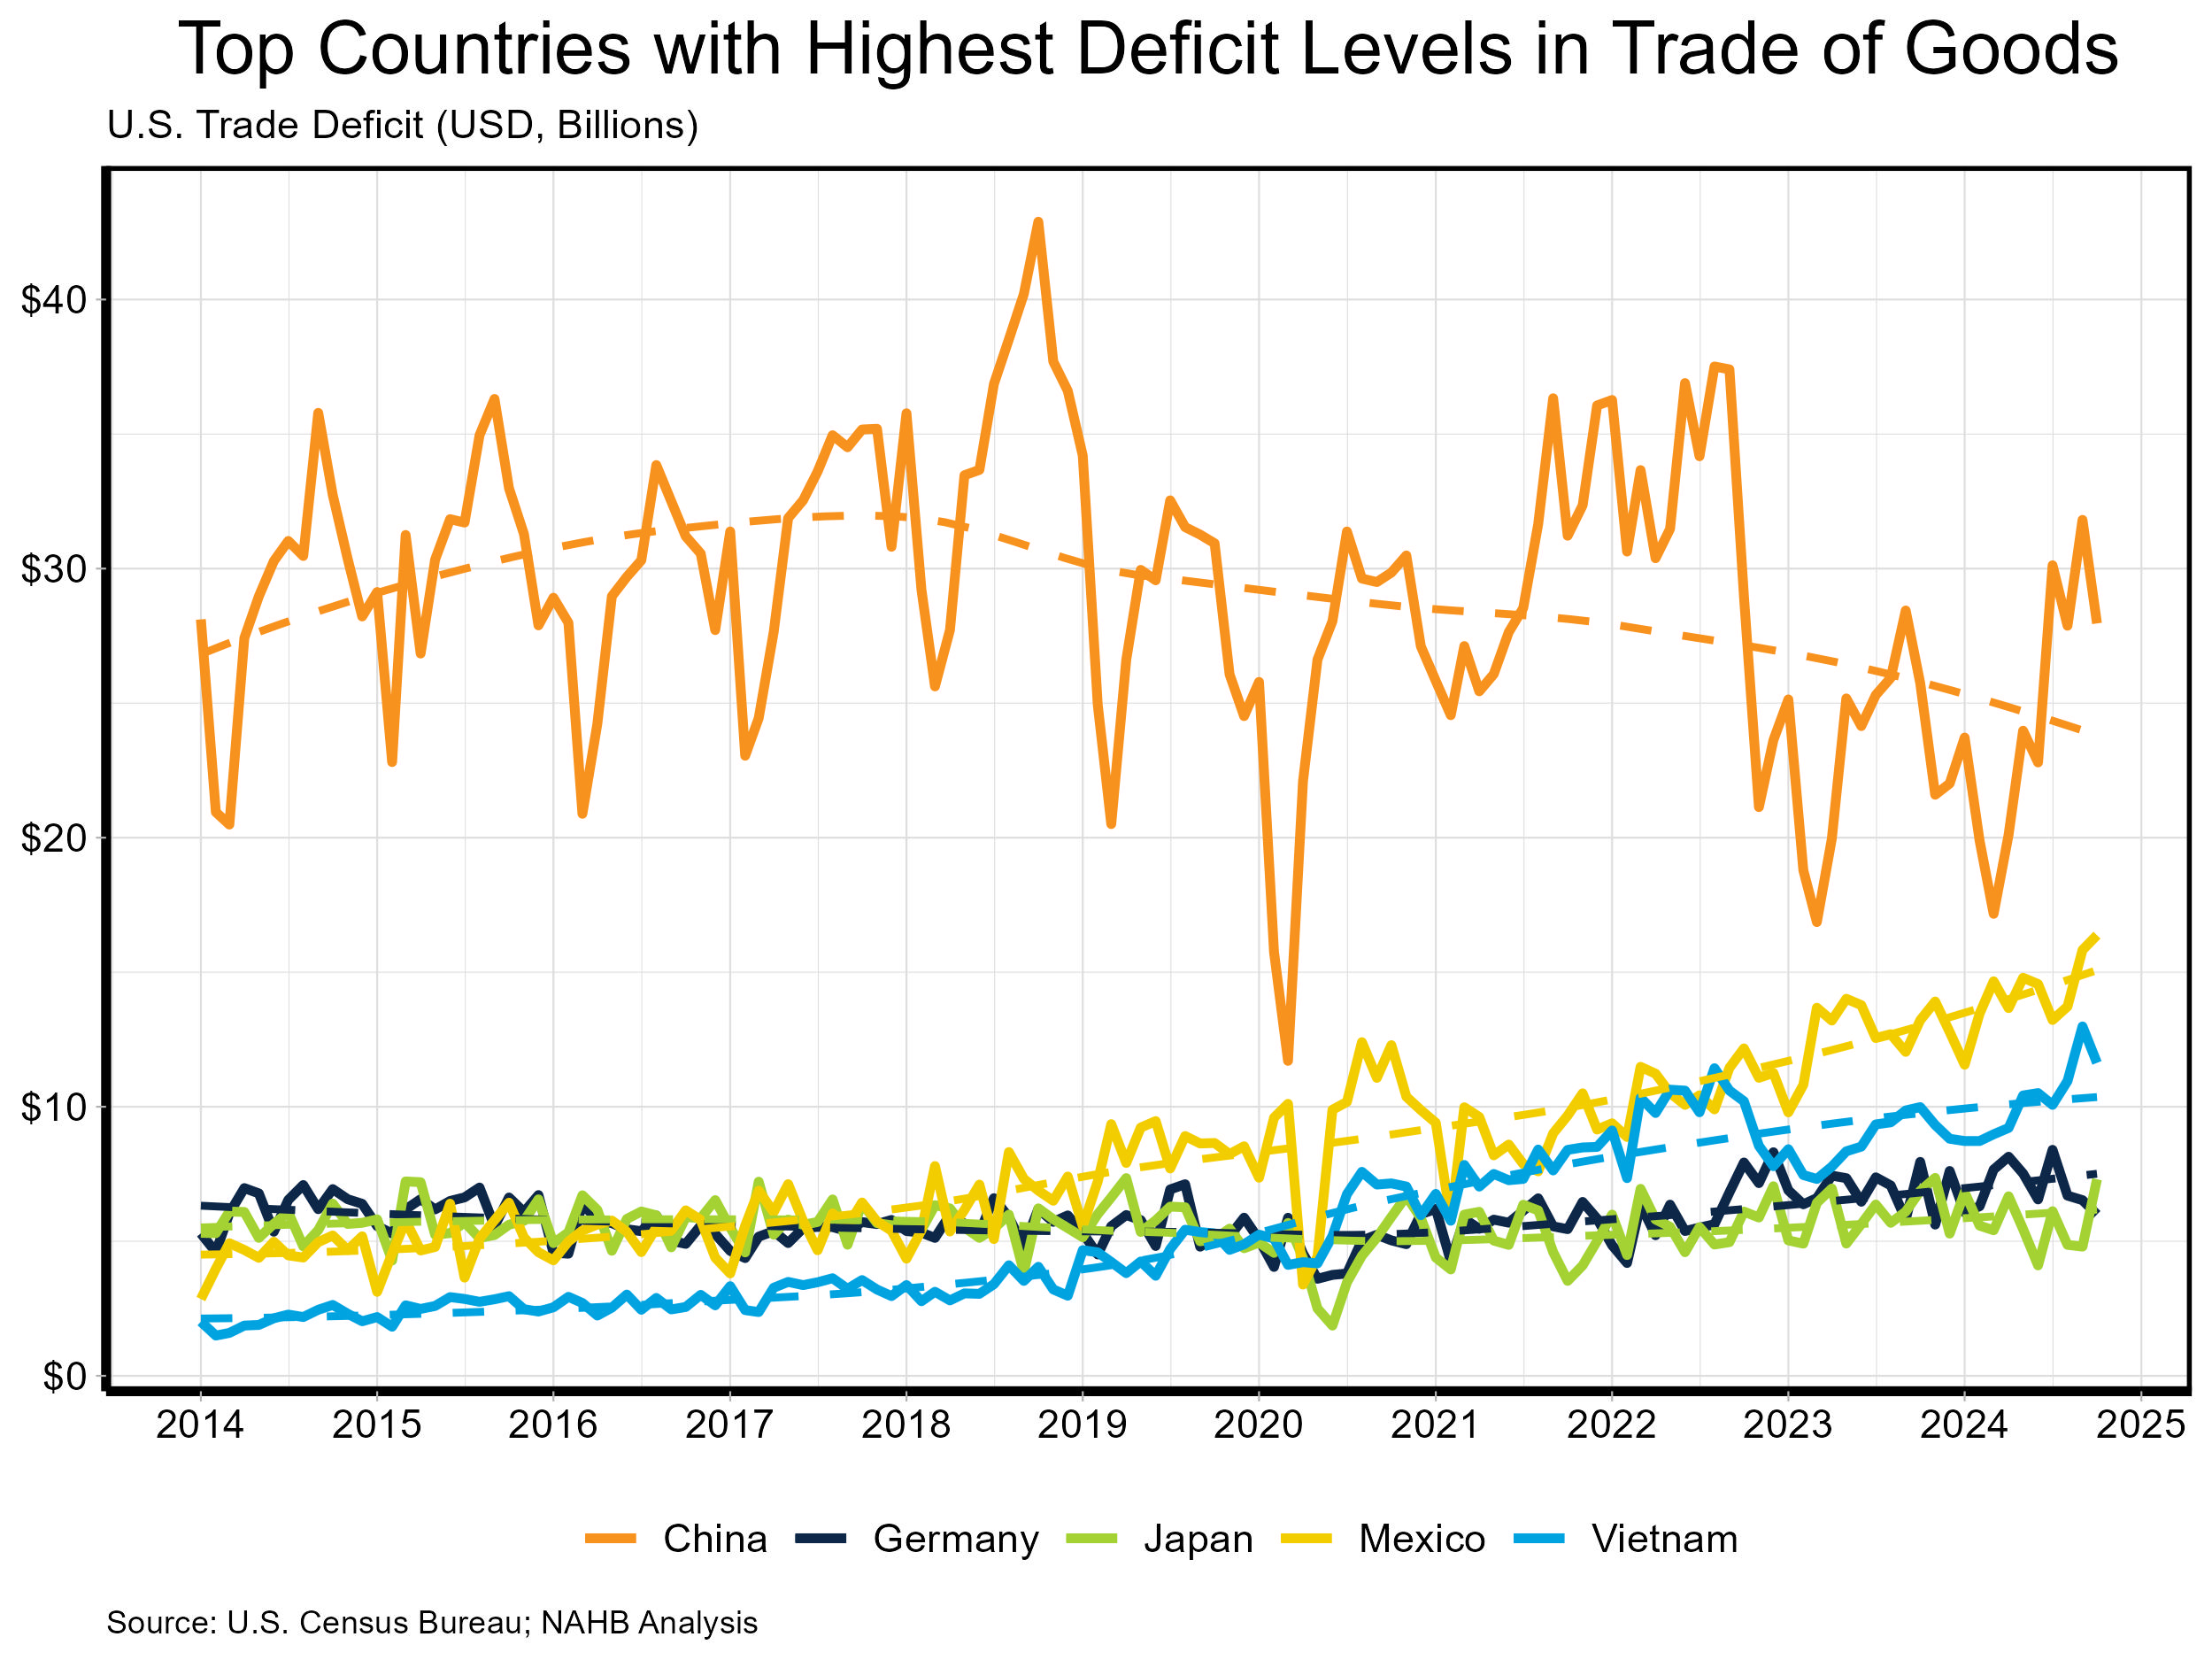
Tracking the dashed trend lines above, the trade deficit with China has moved lower since peaking in 2018. Despite this recent decline, the trade deficit between China and U.S. remains significantly higher than any other country. In October, it was almost double the size of the deficit with Mexico, the second largest. The trade deficit with Mexico and the U.S. has trended upward as trade policy in the U.S. has shifted away from China. The total value of imports from Mexico in October was $45.5 billion, while imports from China stood at $41.5 billion. There also exists a notable increase in the trade deficit with Vietnam. In January 2014, the level stood at only $2 billion, well below other main exporters to the U.S. like Japan and Germany. This level has only continued to rise, caused again by a shift away from trade with China.
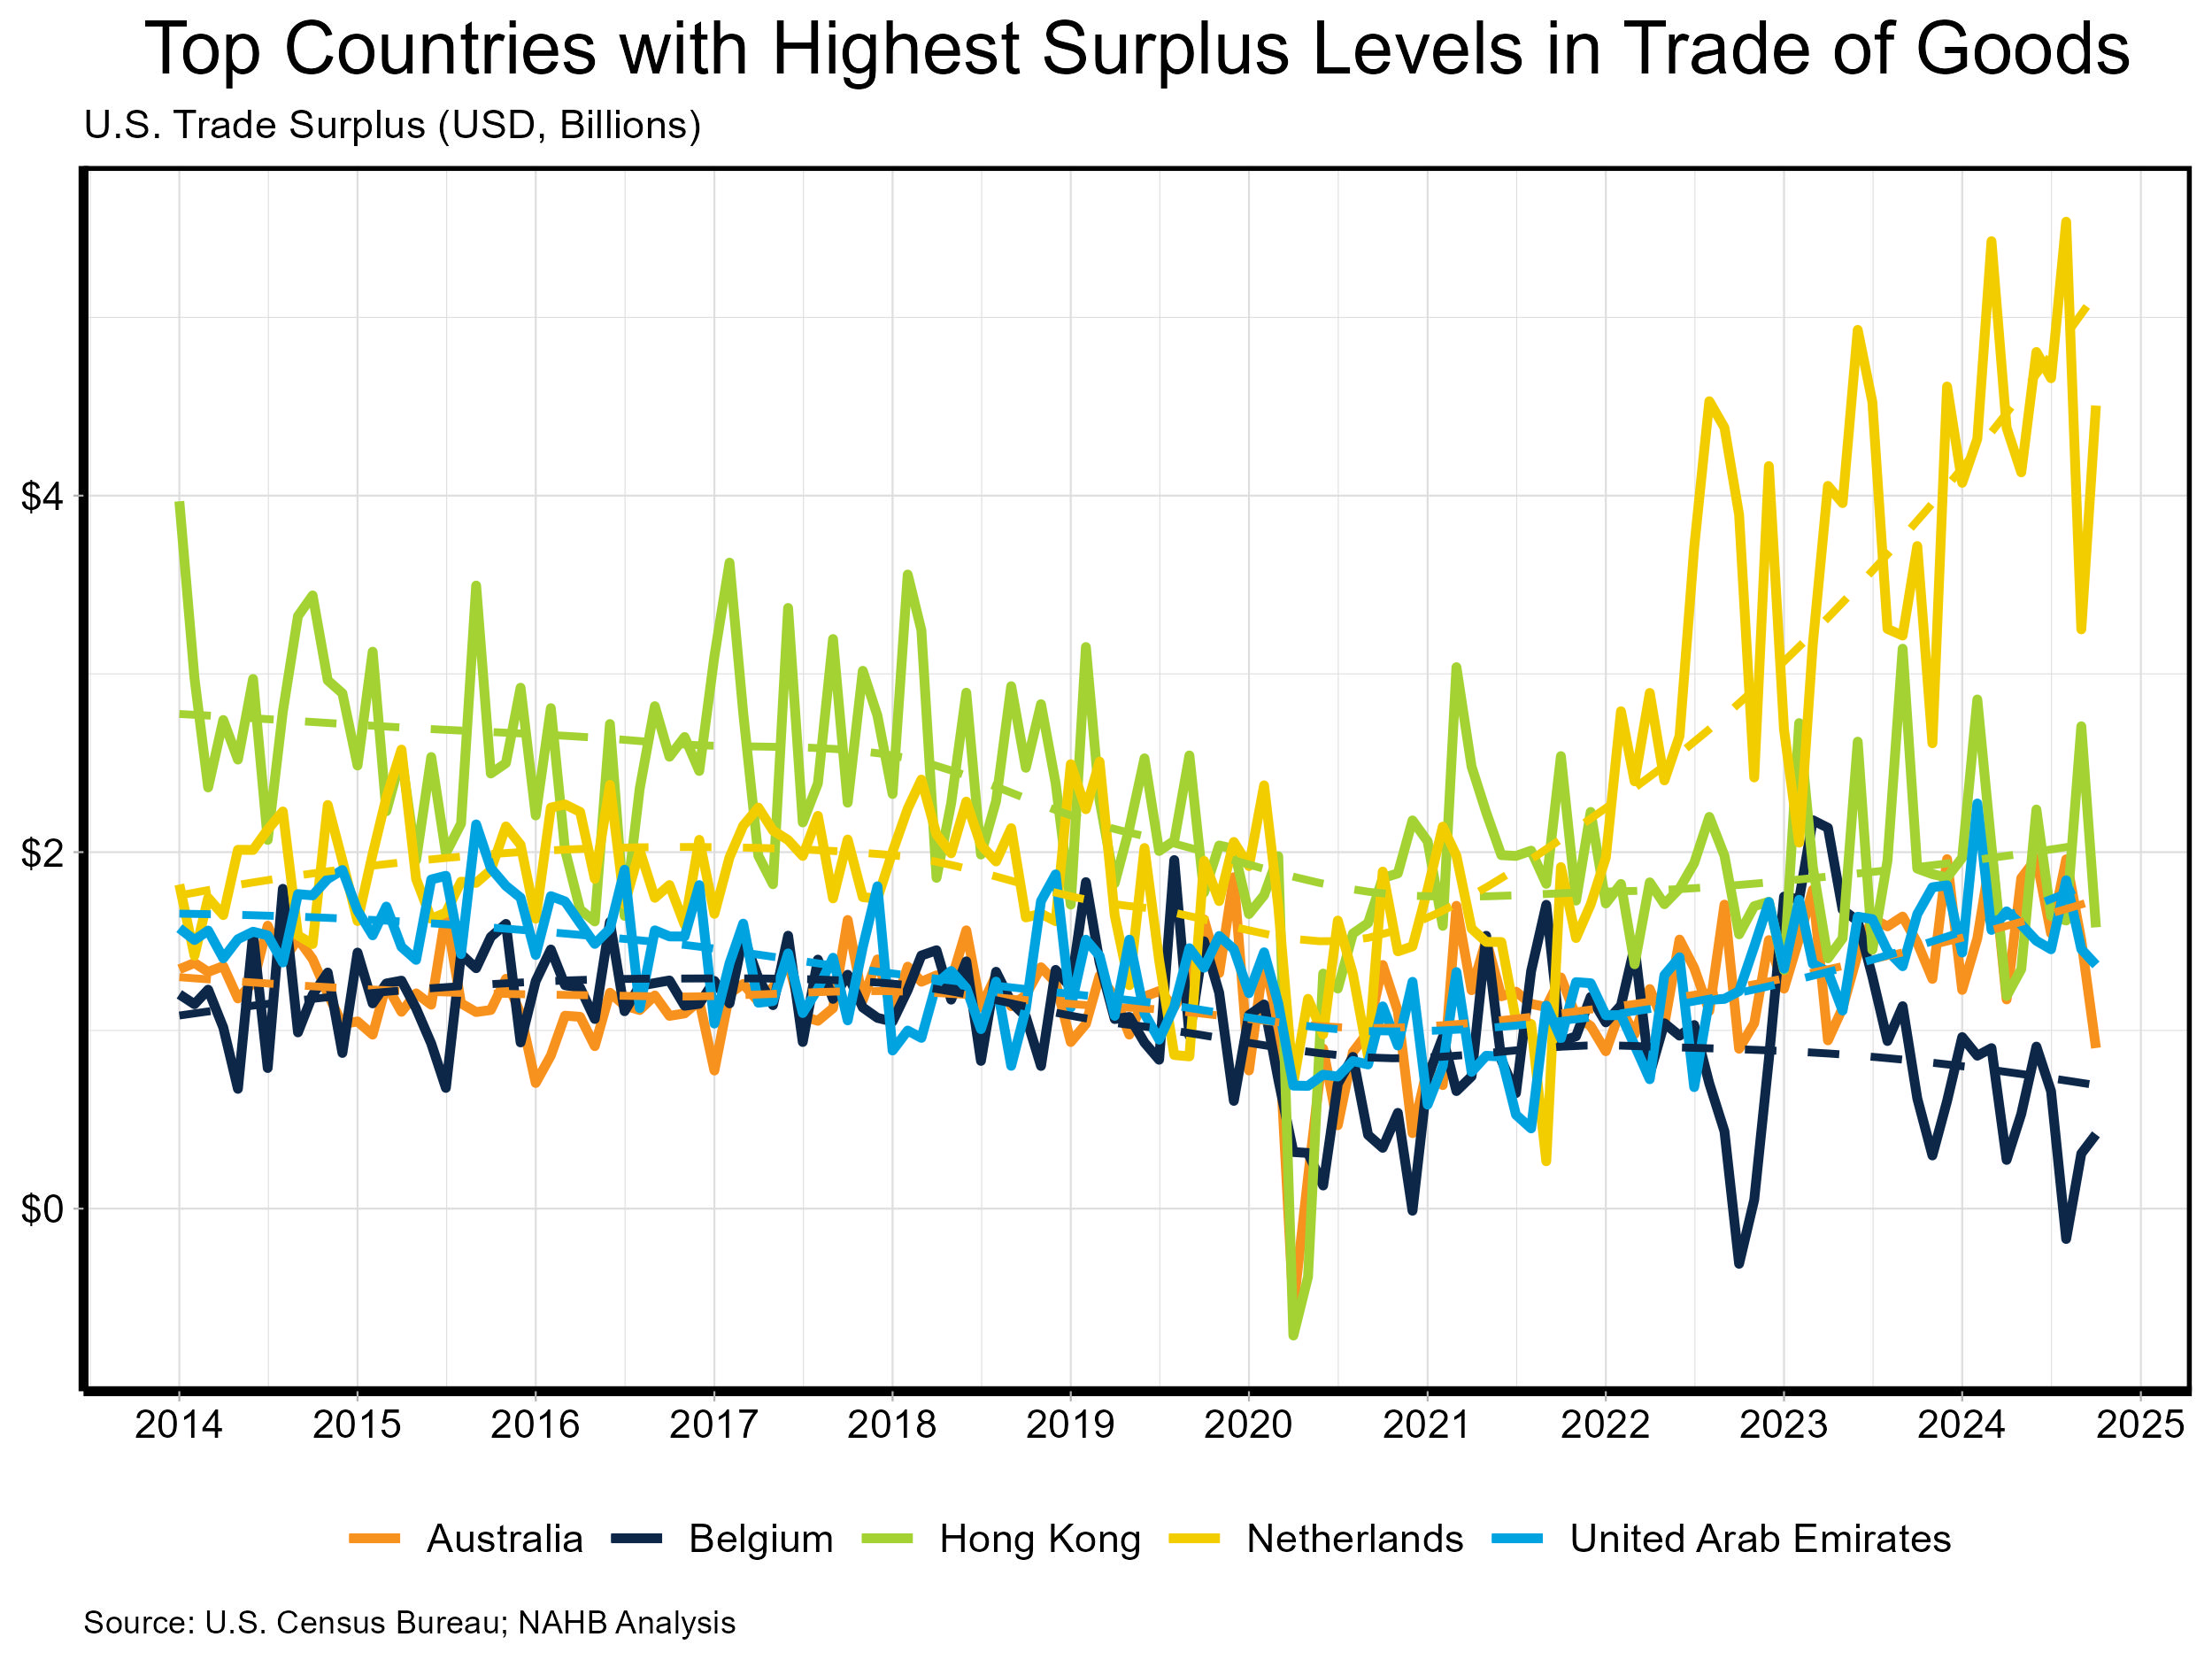
The top countries in October that the U.S. held a trade surplus with were Netherlands ($4.5 billion), United Kingdom ($1.7 billion) and the Hong Kong ($1.6 billion). While these were the highest surplus counties in October, the values are substantially lower than the trade deficit levels shown above. The graph below displays five countries that the U.S. has the largest average trade surplus with over the past 10 years. The surplus with the Netherlands has jumped far higher than any nation since 2022. Trade with Hong Kong historically had the highest until 2018-2019.
While the U.S. has consistently held a trade deficit since 2014, the composition of the deficit is continuing to undergo a transition. Despite a U.S. trade policy that is shifting away from China, the trade deficit with China remains by far the largest the U.S. has with any country. Expansion of trade with Mexico and Vietnam has a seen a rise in trade deficits with both nations, as the U.S. attempts to decouple with China. The data shows that both economies are still very connected, with the U.S. remaining a top destination of exportation from China and U.S. consumers needs for goods from China.
* All content is copyrighted by Industry Intelligence, or the original respective author or source. You may not recirculate, redistribute or publish the analysis and presentation included in the service without Industry Intelligence's prior written consent. Please review our terms of use.